

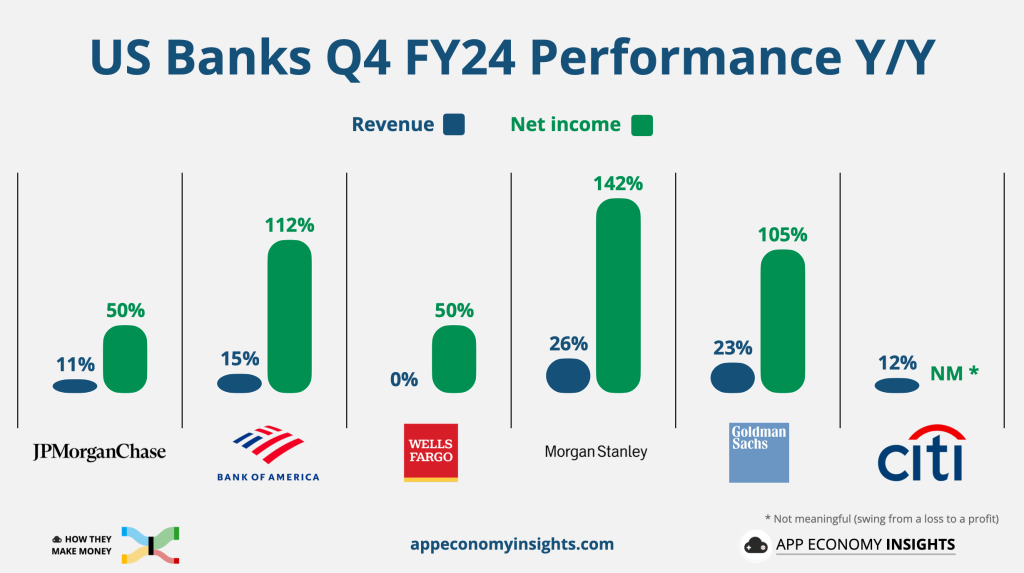
1. US Banks Shine in Q4 FY24: Strong Growth Across the Board
The fourth quarter of FY24 was a great period for big US banks. Many banks showed strong growth compared to last year. JPMorgan Chase had a record year. Bank of America saw a big rise in investment banking. Wells Fargo focused on improving efficiency. Morgan Stanley led in trading. Goldman Sachs made strong progress. Citigroup continued to build momentum. These results show how well the banks are doing in a changing economy.
2. Market Concentration in the S&P 500 Reaches Record High
Did you know something incredible about the stock market? The five biggest companies in the S&P 500 are now as big as the bottom 407 companies put together! Think about that for a moment. Apple, Nvidia, Microsoft, Google, and Amazon are giants. Their total value has skyrocketed to $15.3 trillion. Since last year, they’ve gained $5 trillion in value!
This is a huge amount of money. It’s almost as much as the entire stock markets of China and Hong Kong combined. These top 5 companies now make up a record 24% of the whole US stock market. We’ve never seen numbers like this before. It shows just how powerful these few companies have become.

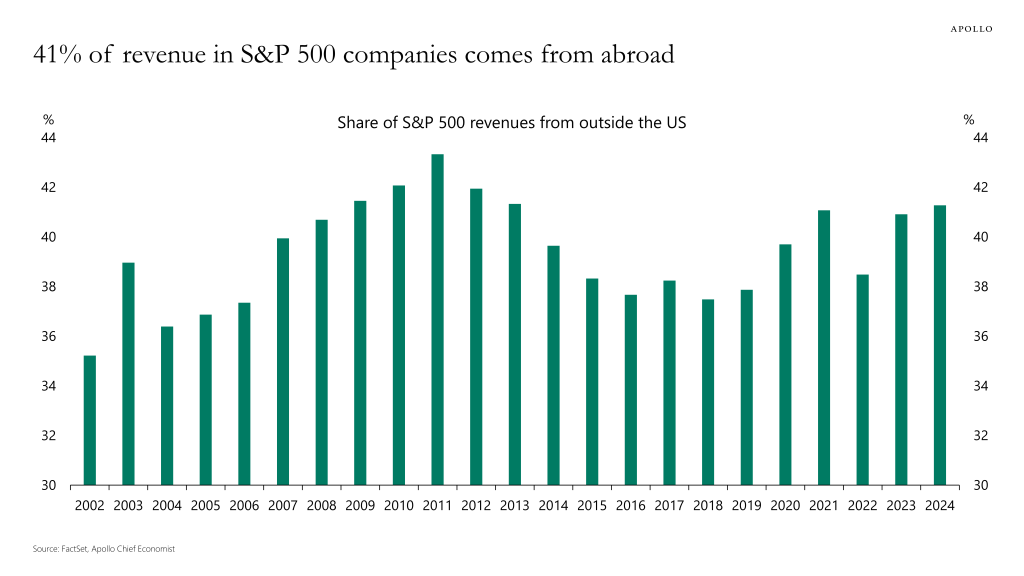
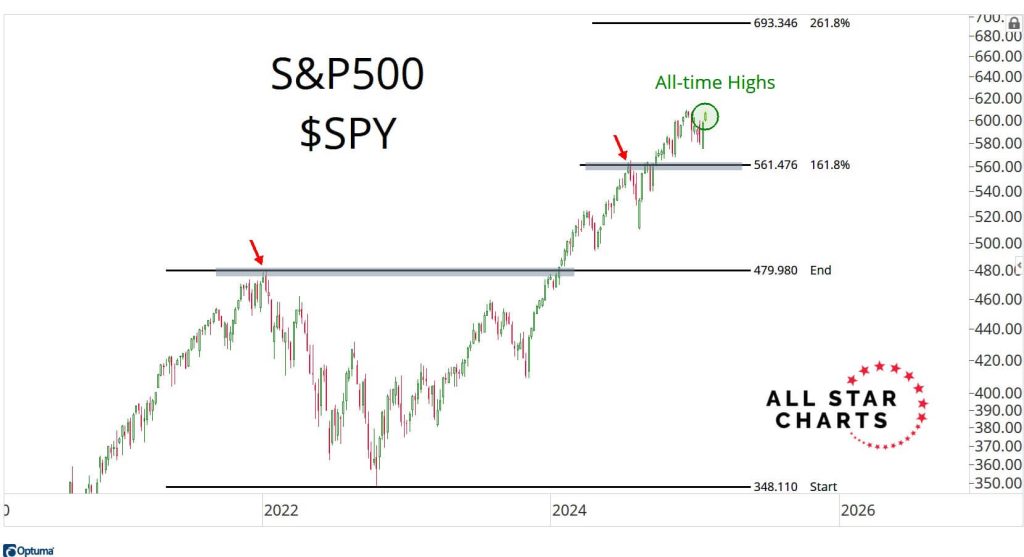
3. S&P 500: Strong at Home, But Vulnerable Abroad?
Right now, many investors think the US economy is doing really well, while Europe, the UK, and China are facing problems. This positive view of the US is influencing market trends. However, there’s a catch: a big portion of the money made by companies in the S&P 500 comes from other countries.
In fact, 41% of their earnings are from overseas. This means that if Europe has a serious economic downturn (a recession) or China’s economy keeps weakening, it could significantly affect how much money S&P 500 companies make. This is a risk that Apollo highlights, suggesting that the US market might be too optimistic about ignoring global challenges.
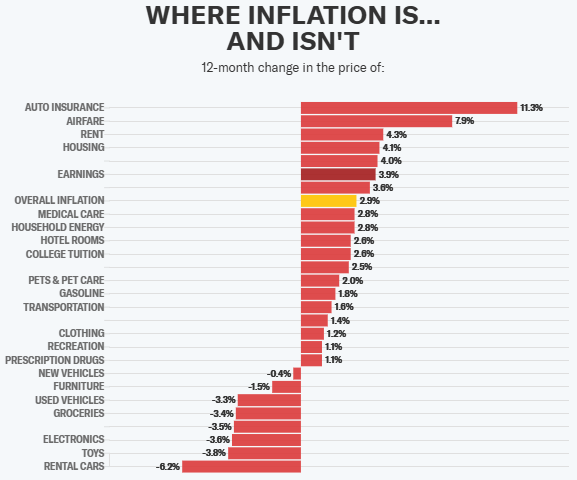
4. Inflation’s Mixed Bag: Some Prices Cool, Others Stay Hot
The latest inflation report shows a mixed picture. Overall inflation rose as expected, but when we take out things like food and gas, the increase was a bit smaller, suggesting inflation might be slowing down slightly. However, many everyday costs are still going up. Things like rent, healthcare, and some food items are costing us more.
While food prices have calmed down a little, there are still some big jumps. Eggs are a prime example, costing much more than they did last year. Other items like beef and frozen juices have also seen price increases. Eating out is also a bit more expensive. Healthcare costs continue to climb, with home healthcare and hospital services increasing. Even though car prices aren’t rising as fast, other car-related expenses, like insurance and repairs, are still going up. On the bright side, gas prices did increase in December, but they remain relatively stable compared to the volatility seen in previous years.
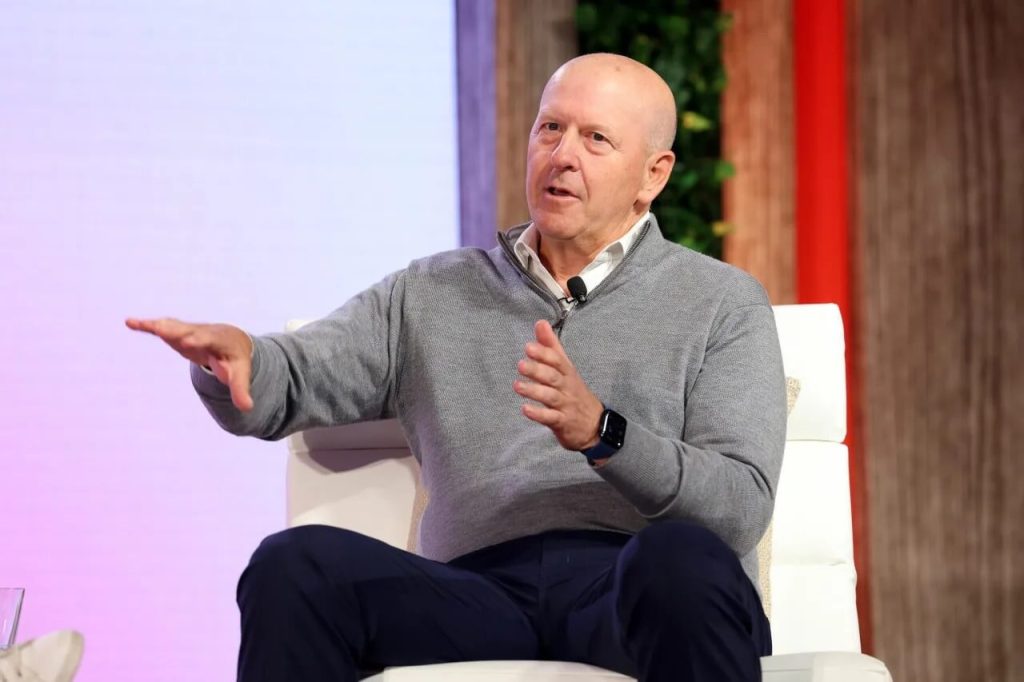
5. AI Revolutionizes IPO Prospectuses: Goldman Sachs CEO Highlights Dramatic Shift
Goldman Sachs CEO David Solomon has revealed the incredible potential of artificial intelligence in finance. He stated that AI can now create 95% of a company’s initial public offering (IPO) prospectus (a document called an S1) in just minutes. This task used to take a team of six people several weeks to complete.
Solomon emphasized that because AI can handle the bulk of the work so quickly, the remaining 5% of the prospectus, requiring human expertise and judgment, has become even more critical. It’s what sets a good IPO apart now that the initial drafting process is largely automated.
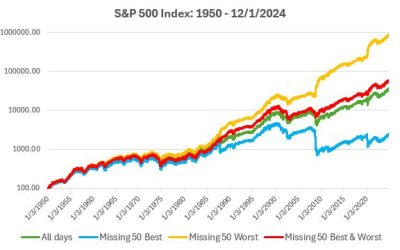
6. Peter Lynch’s Wisdom: Is Market Timing a Costly Mistake?
Legendary investor Peter Lynch offered a valuable insight: investors often lose more money trying to predict market downturns than they do from the downturns themselves. Many people sell their investments when they anticipate a market correction. This can lead to missed opportunities if the market continues to rise.
Even if a correction does occur, fear might prevent investors from reinvesting when prices are low. Essentially, attempting to time the market can cause investors to miss potential gains both during upturns and the subsequent recovery. Lynch’s observation serves as a reminder that consistently and accurately predicting market movements is extremely challenging, and a long-term investment strategy is often more rewarding.
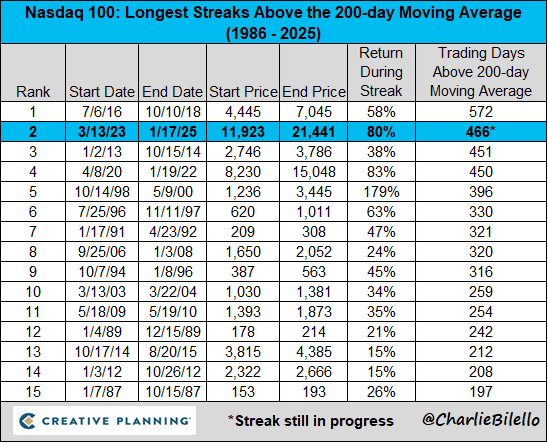
7. Nasdaq 100: Riding a Historic Wave
The Nasdaq 100, a major stock market index, is currently experiencing a remarkable period of growth. It has remained above its 200-day moving average for 466 consecutive trading days. This impressive streak is the second longest in history, indicating a strong and sustained upward trend. This data highlights the power of long-term positive momentum in the market.
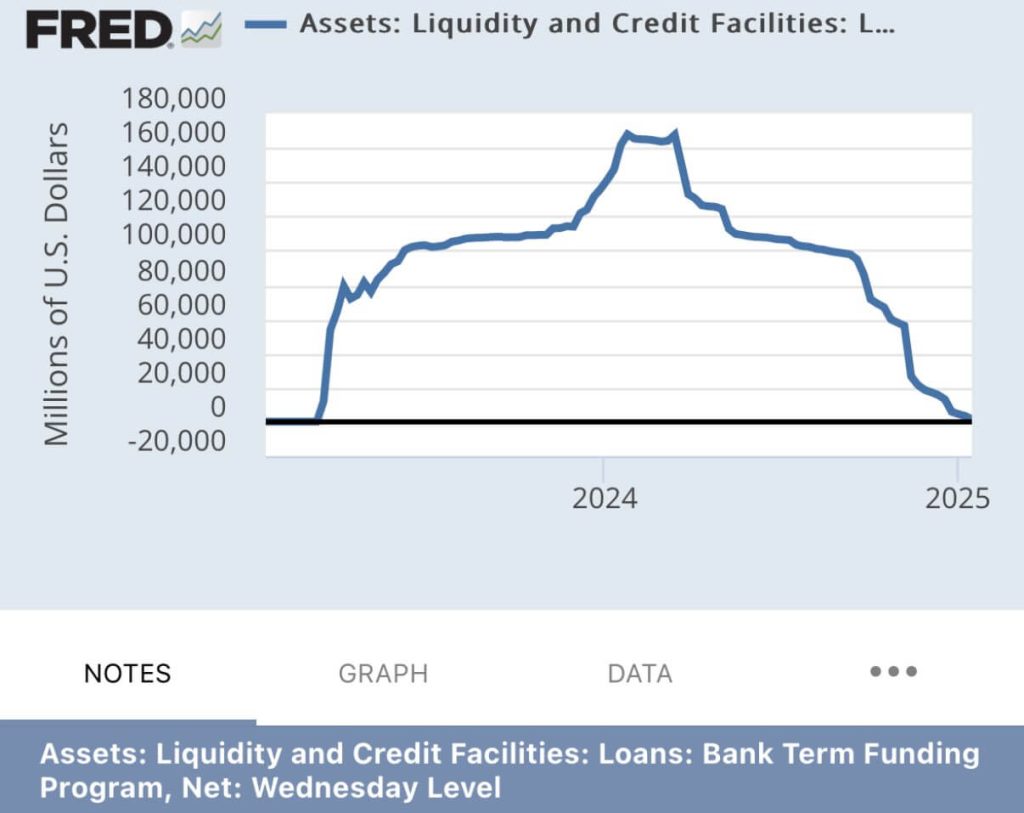
8. Critical Update on Regional Banks
The BTFP, introduced during Biden’s presidency, was a vital support system for regional banks. It allowed them to exchange problematic, low-yield debt for loans at full value, effectively masking their financial instability. This program provided a temporary lifeline, helping these banks stay afloat.
However, with the program now exhausted and no longer available, the regional banking system is facing significant challenges. Without the safety net of the BTFP, these banks are struggling to maintain their financial health, leaving the sector vulnerable and on the brink of collapse under Trump’s administration. This situation underscores the importance of government support in maintaining financial stability.
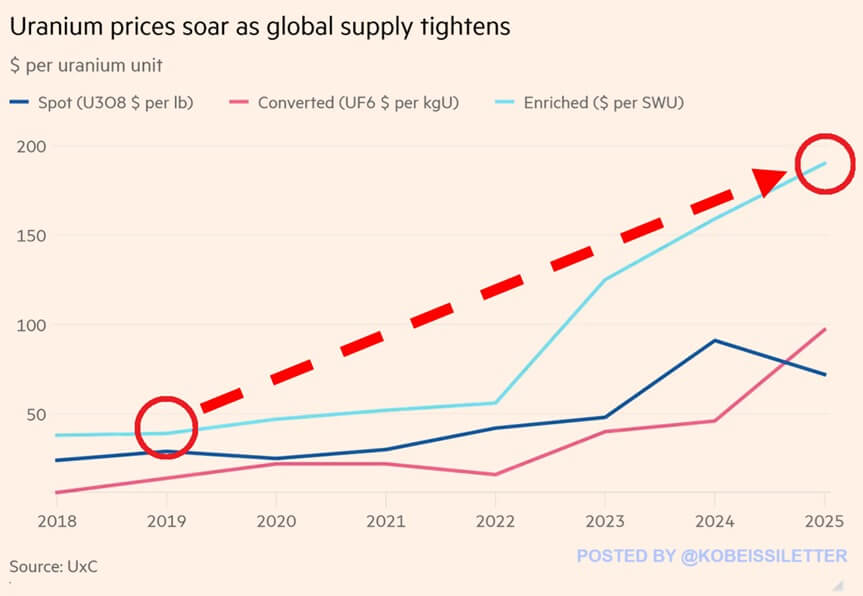
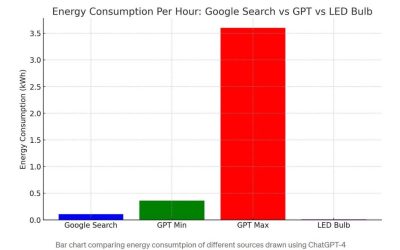
9. Uranium Heats Up: AI’s Energy Demand Sparks Price Surge
The price of enriched uranium has hit a record high, reaching $190 per separative work unit. This marks an increase of approximately 240% over the past three years. This surge is driven by growing interest in nuclear power as a clean energy source, particularly for data centers powering artificial intelligence.
Major companies like Amazon and Microsoft are exploring nuclear energy to meet the intense electricity demands of their AI operations. As the world seeks carbon-free energy solutions, nuclear power is gaining renewed attention.
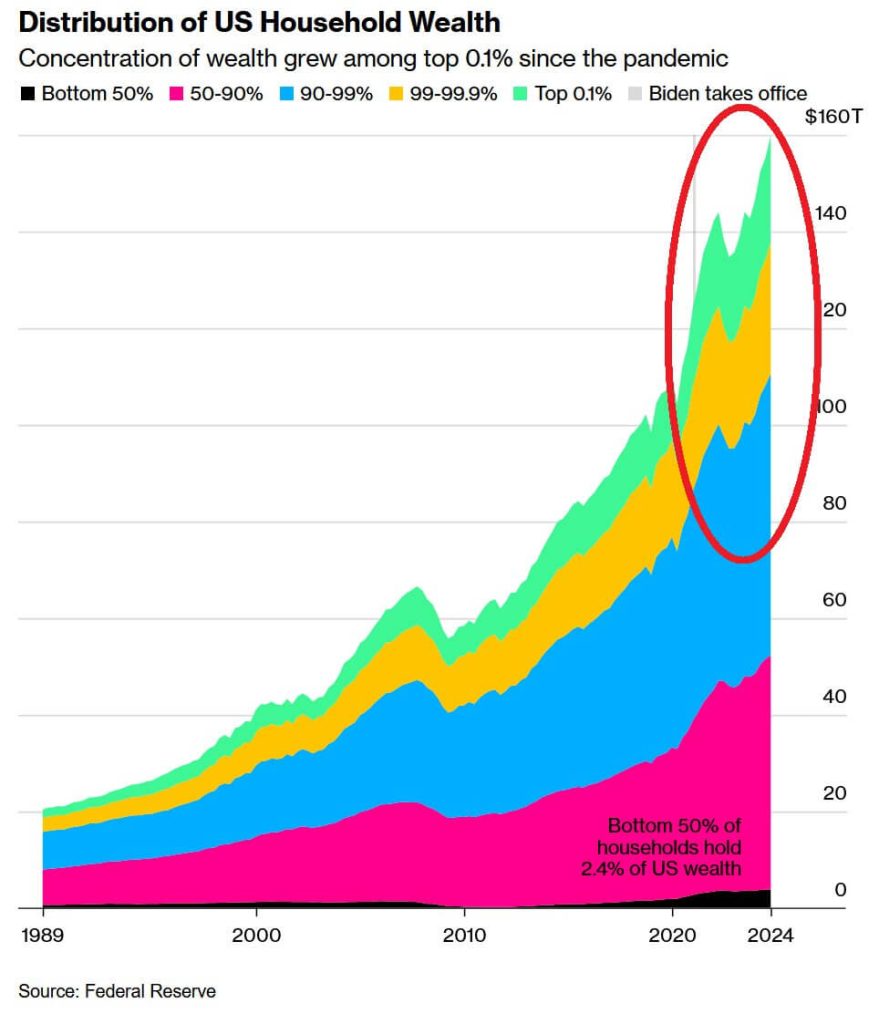
10. Wealth Divide: Top 10% Holds 69% of the Pie
The current financial system shows a significant wealth gap. The richest 10% of households in the US now hold $111 trillion in wealth, which is a staggering 69% of the nation’s total wealth.
In contrast, the bottom 50% of households possess only $3.9 trillion, representing a mere 2.4% of overall wealth. Even more concerning, since 2021, the wealth of this bottom half, when adjusted for inflation, has decreased by 5%.

0 Comments